One of the recurring questions on MES projects is: how do you build analytical dashboards on data that lives in MongoDB, without rewriting the backend to a SQL database? In OmniMES we use Redash for this — for two reasons. First, Redash can consume a REST API as a data source. Second, it has a Query Results mechanism that lets you write full SQL on the result of any earlier query.
The combination proves to be a game changer for many MES deployments: SQL power (JOIN, CTE, window functions) over a NoSQL backend, with zero changes in the production layer. This article walks through the setup step by step — from configuring Redash, through querying the OmniMES REST API, to a SQL query that computes a vibration trend, and a ready visualization on a dashboard.
Why Redash
OmniMES generates tens of thousands of documents per day — machine telemetry, production order status, alarms, energy counters, OEE logs. We store this in MongoDB, because the data schema across machines is heterogeneous (one structure from a lathe, another from a hardening furnace, another from a compressor room), and MongoDB handles that variability far better than a traditional RDBMS.
The problem appears at the presentation layer. Standard OmniMES dashboards cover about 80% of typical needs — OEE, micro-downtimes, shift reports, energy consumption. The remaining 20% are plant-specific: vibration trend analysis, correlation of defects with mold temperature, distribution of micro-downtimes per operator. For those cases we don't want to ship a custom dashboard per client — we prefer to hand over a self-service tool where the analyst or process engineer writes the query themselves.
Redash satisfies three key requirements:
- Open source (BSD-2) — can be hosted in the customer's own infrastructure next to OmniMES, important for on-premise or isolated OT networks.
- Dozens of data sources — PostgreSQL, MongoDB (limited), BigQuery, ClickHouse, Presto, plus JSON/URL and Query Results.
- Straightforward sharing — a dashboard can be published as a public link with a token, embedded in an iframe on the OmniMES side, or in the customer's intranet.
Solution architecture
OmniMES backend (Node.js / Python) ──► MongoDB
                │
                ▼
     REST API: /data/dataBi/?server=0&line=0&machine=0&...
                │
                ▼
┌──────────────────────── Redash ────────────────────────┐
│                                                        │
│  Data Source: JSON  ──► Query 56: raw data             │
│                                │                       │
│                                ▼                       │
│  Data Source: Query Results ──► Query 57: SQL + trend  │
│                                │                       │
│                                ▼                       │
│  Visualization: scatter + trend line                   │
│                                │                       │
│                                ▼                       │
│  Dashboard: "CNC vibration monitoring"                 │
│                                                        │
└────────────────────────────────────────────────────────┘
The key idea: the OmniMES REST API is the first query layer, SQL is the second. MongoDB itself does not speak SQL, but once the REST endpoint returns JSON in tabular form, Redash treats it as a regular table on top of which we can run any SQLite SQL (the engine Redash uses for Query Results).
Step 1 — Configure data sources in Redash
Sign in to Redash as admin and go to Settings → Data Sources. We need two sources:
- JSON — to query the OmniMES REST API.
- Query Results — the built-in "meta source" that lets us run SQL on the output of other queries.
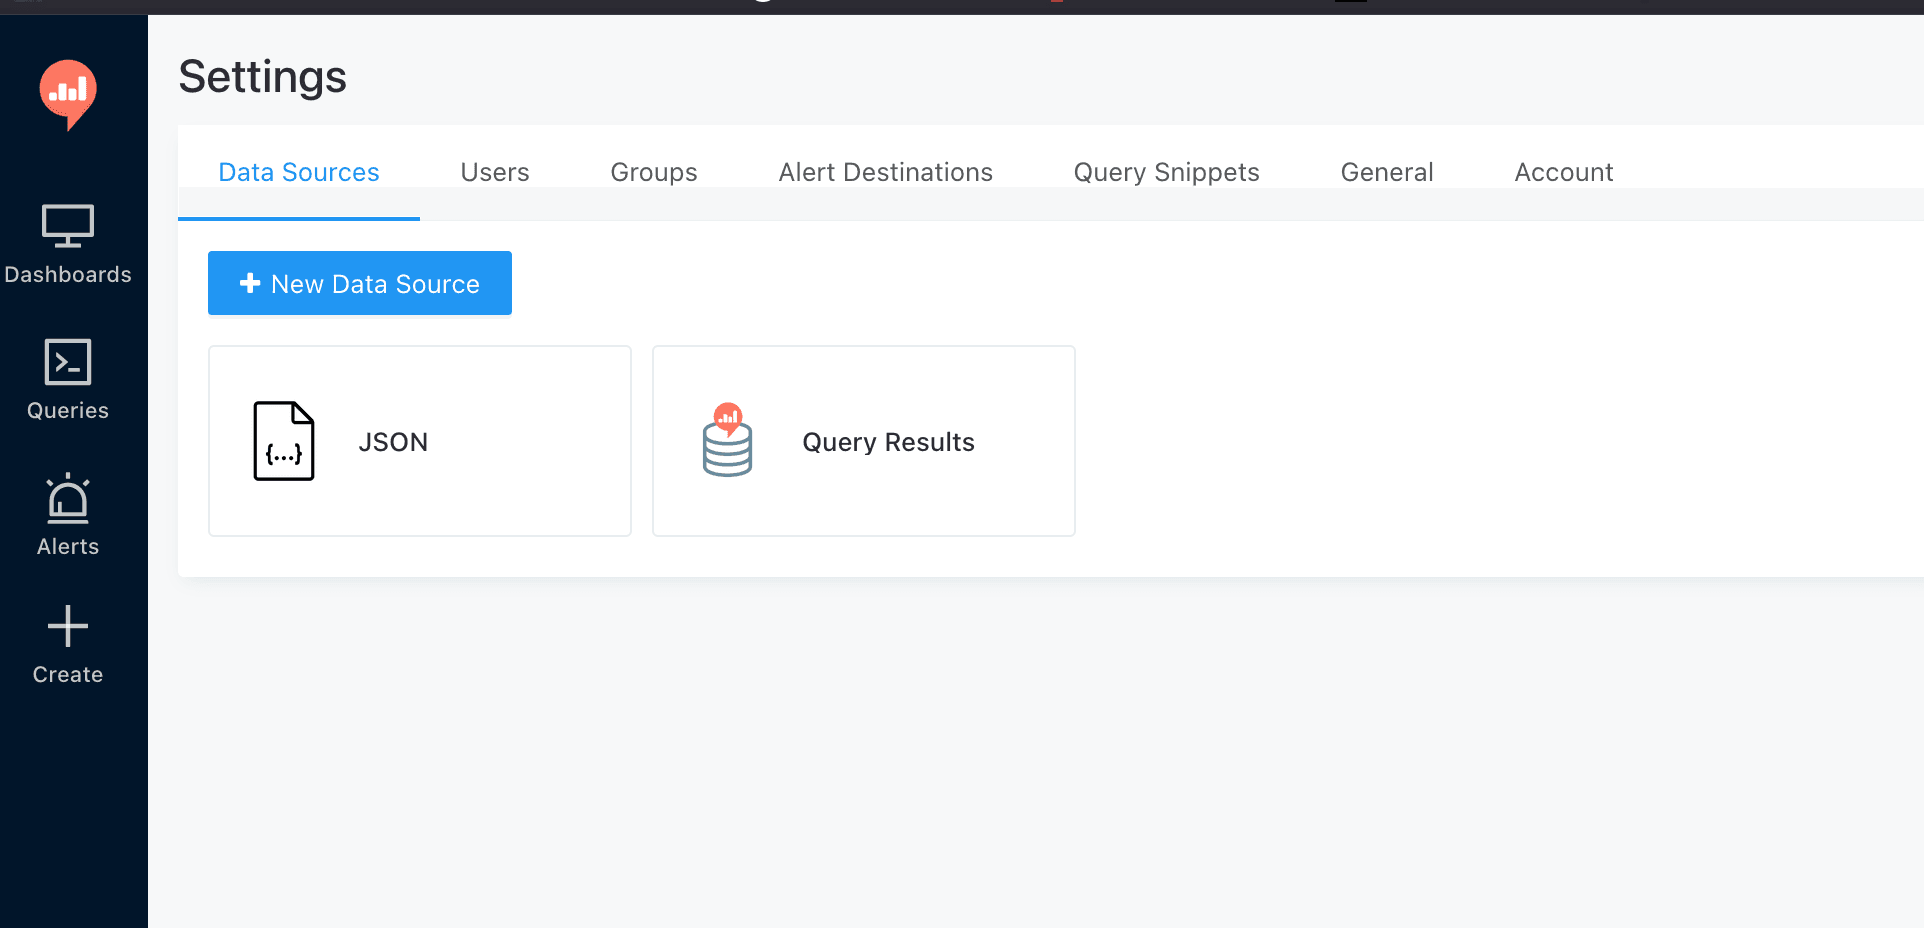
Click + New Data Source, pick JSON, and give it a name (e.g., OmniMES REST). The configuration panel is minimal — no host or port, because the full URL goes inside each query's body. Then add a second source of type Query Results. This is an embedded SQLite engine that indexes the results of every earlier Redash query and exposes them as tables named query_<id>.
Step 2 — Base query: pull data from the REST API
Create a new query, pick OmniMES REST as the source, and in the body write the YAML-style payload the JSON source expects:
url: http://api:8091/data/dataBi/?server=0&line=0&machine=0&type_data=0&type_event=1&period=1h
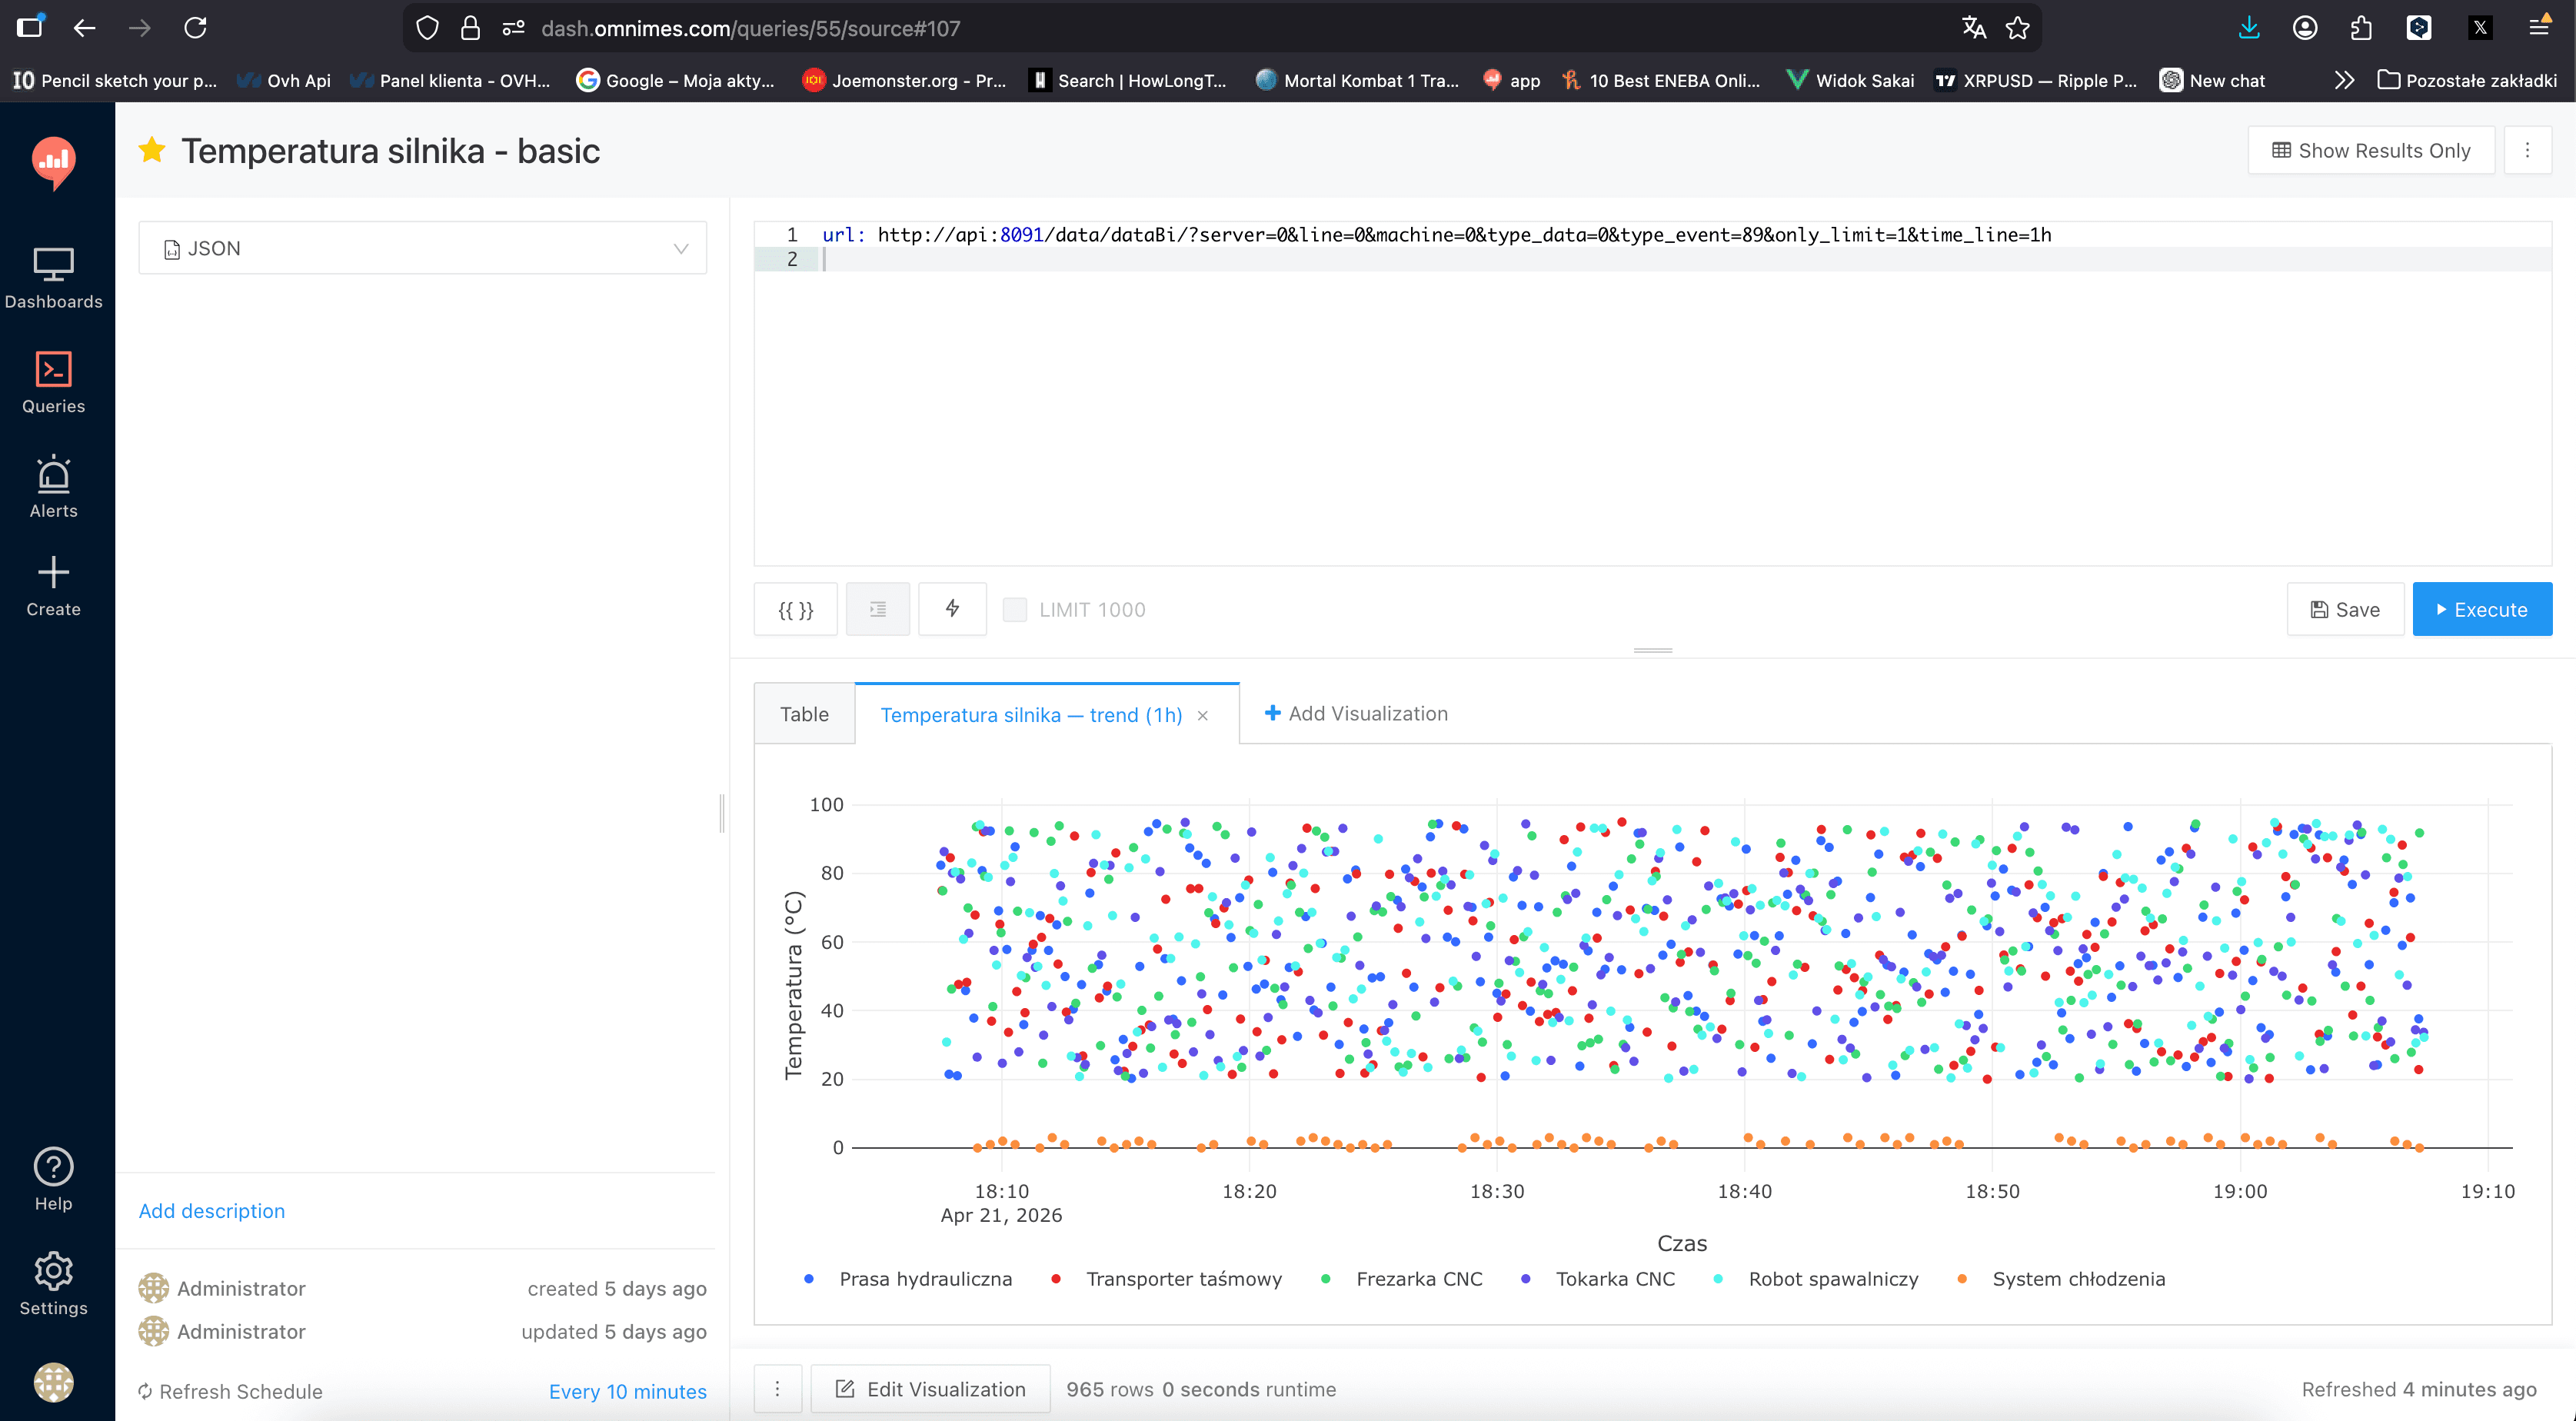
Redash runs the request, parses the JSON response into a table, and assigns the query an internal ID (e.g., 56). That ID is what we use in the next step.
URL parameters are meaningful:
server— OmniMES instance identifierline— production linemachine— machine ID (0 = all)type_data— data kind (measurement, event, state)type_event— event class (vibration, temperature, current, …)period— time window returned by the API
In production we parameterize these with Redash's {{machine}} and {{period}} syntax, so the dashboard user picks a machine and time range without writing SQL.
Save the query as Vibration level — basic and set the Refresh Schedule — 10 minutes in this case. Redash will poll the API periodically, cache the result, and expose it both to this visualization and to any other query that references the same ID.
Step 3 — SQL on results: compute the trend
Now create a second query, this time against the Query Results source. Reference the earlier query as query_56 and layer SQL on top:
SELECT
  bucket AS datetime_add,
  COALESCE(
    MAX(CASE WHEN name_machine = 'Tokarka CNC' THEN value END),
    NULL
  ) AS lathe,
  COALESCE(
    MAX(CASE WHEN name_machine = 'Frezarka CNC' THEN value END),
    NULL
  ) AS mill,
  MAX(CASE WHEN name_machine = 'Tokarka CNC' THEN trend END) AS lathe_trend,
  MAX(CASE WHEN name_machine = 'Frezarka CNC' THEN trend END) AS mill_trend
FROM (
  SELECT
    strftime('%Y-%m-%d %H:%M:', datetime_add) ||
      printf('%02d', (CAST(strftime('%S', datetime_add) AS INT) / 30) * 30) AS bucket,
    value,
    name_machine,
    AVG(value) OVER (
      PARTITION BY name_machine
      ORDER BY datetime_add
      ROWS BETWEEN 5 PRECEDING AND 5 FOLLOWING
    ) AS trend
  FROM query_56
)
GROUP BY bucket
ORDER BY bucket;

What this query does:
- The inner SELECT projects every sample into a "30-second bucket" (
bucket) and computes a rolling average over 11 neighbouring samples (5 before, 5 after, current) — that is our trend line. - The outer SELECT pivots the data by machine (Tokarka CNC, Frezarka CNC), producing a table with columns
datetime_add,lathe,mill,lathe_trend,mill_trend. - We use
strftime+printf(full SQLite) to round the timestamp precisely to 30s — a useful technique when chart granularity must be controlled regardless of what the REST API returns.
This is where the critical thing happens. The data physically came out of MongoDB, but we write full SQL with a window function AVG() OVER (PARTITION BY ... ROWS BETWEEN ...) against it. No native Mongo query (not even $setWindowFields) would give us a form this readable — and we get it for free, because Redash runs SQLite on its cache.
Step 4 — Visualization
The two presentation styles we combine most often:
- Scatter plot — every raw sample as a dot (blue Tokarka CNC, red Frezarka CNC).
- Line —
lathe_trendandmill_trendas smooth curves showing direction.

Together they give a readable picture: the operator sees instantaneous noise (scatter) and at the same time the direction in which the process drifts (trend). For maintenance, this is the first signal that a bearing or a guide rail is starting to behave outside normal — well before it crosses a hard alarm threshold.
In Redash, go to Edit Visualization, pick Chart, set datetime_add as the X column, the four remaining columns as Y columns, use style points for the raw values and line for the trends. Colours follow the OmniMES palette (blue = first machine, red = second).
Step 5 — Dashboard and sharing
Pin the query with its visualization to a dashboard called CNC monitoring — vibrations. In Redash a dashboard can be:
- Shared as a public tokenized link — external users see it without signing in, but the URL contains a random token so Google won't surface it.
- Embedded in an iframe — on your own site, the customer intranet, or directly in an OmniMES view.
- Shared internally — based on Redash roles (e.g., operators see only their line).
We also set a dashboard-level refresh of 10 minutes — every widget refreshes in sync, the user always sees a fresh picture without manual reload.
Value compared to the native OmniMES dashboards
This is not "instead of" but "alongside" the native OmniMES views. The practical upside:
- Full SQL on NoSQL without migration. CTE, JOIN between queries, window functions, window frames, aggregation — all on data that physically lives in MongoDB. For the analytics team, this saves weeks compared to writing equivalent aggregations inside a MongoDB pipeline.
- Zero changes in the OmniMES backend. Each new analysis is a new Redash query — it does not touch production code, does not require deployment, does not break SLA.
- Self-service for the customer. A process engineer, an analyst, a shift leader — each builds their own charts without involving developers. In projects where we rolled this out, "please produce another report" tickets dropped by 60–80% within the first quarter.
- Shared dashboard repository. Redash keeps every query and every dashboard in one place with versioning (diff, rollback), tags, and categories. Tribal knowledge about "how is OEE computed after the shift cut-off" or "where is the quality report for product X" stops drifting between emails and Excel files.
OmniEnergy — same pattern, different endpoint
OmniEnergy is the OmniMES module dedicated to energy efficiency management (EMS compliant with ISO 50001). Architecturally it uses the exact same pattern: electric, gas, and compressed-air meter telemetry lands in MongoDB and is exposed via /data/energyBi/.
In Redash we build dashboards like:
- Energy consumption per zone / machine / shift — broken down by carrier.
- Energy intensity (kWh per unit produced) — correlated across
dataBi×energyBi. - ISO 50001 report — monthly, exported to PDF and mailed to the energy management system owner.
- Shift / line / period comparisons — with a statistical significance test, easy to write in SQL.
All of it on the same pair of data sources (JSON + Query Results), just different URLs and different SQL.
Barriers and limits — an honest account
The approach is powerful but not universal. Things to know before rolling it out:
1. Query Results has size limits
By default, Redash holds at most one million cells (row × column) in a single cached Query Results output. At 360 samples × 5 columns (our example) this is fine. With second-level data over an hour across 20 machines × 40 columns — it isn't. Sensible pre-aggregation on the REST side (e.g., 30s averaging inside the API) is always the first step before the result hits Query Results.
2. Refresh is cascading
Every Query Results SQL waits for its base query to finish first. If the base endpoint takes 8 s and the Query Results SQL takes 2 s, total is 10 s, not 2. For a dashboard with 12 widgets, you plan the refresh schedule so base queries refresh earlier than the dependent ones.
3. This is not real-time
Typical refresh is 5–10 minutes. For MES this is acceptable for trend analysis, but for reactive alarming (stop the line when vibration exceeds the threshold) we always use a separate path — directly from the OmniMES backend over WebSocket to the operator HMI. Redash is an analytics tool, not a control tool.
4. SQL dialect
Query Results uses SQLite 3. It is a very capable dialect 90% of the time, but it lacks native PIVOT, full regex, and some advanced time functions. Occasionally you need to layer queries (a cascade of Query Results) rather than fit everything into one SQL statement.
5. Security
The OmniMES REST endpoint must not be publicly exposed — it belongs inside a trusted network (VPN, private VLAN, zero-trust service mesh). Redash keeps its cache inside its metadata database, so query results are also protected by Redash's access policy. For customers in regulated sectors (pharma, critical energy) we add SSO (SAML, OIDC) and audit logging.
Practical best practices
A few rules we have refined across rollouts:
- One base query, many derivatives. Don't issue 15 separate REST calls — one wide endpoint plus 15 Query Results SQL queries on top. Saves requests and infrastructure cost.
- Prefix names by plant.
KLN_vibration_trend,KLN_OEE_per_shift— at 200 Redash queries, it saves your sanity. - Tag your queries. Minimum:
raw,agg,viz,dashboard-ready— everyone knows what is base and what is the final view. - Use a staging instance. Redash has archive mode — every query change is kept in history — but a separate staging instance prevents breaking production dashboards while iterating.
- Document in the query description. The Description field beneath a query — a short note on what it computes, what parameters it takes, and what it is for.
Bottom line
Analytical dashboards on MongoDB data without rewriting the backend are doable — all it takes is the REST API as the first layer + Redash Query Results as the second. In OmniMES and OmniEnergy this is standard on projects where a customer needs custom views beyond the native dashboards.
Cost to deploy is low: Redash is open source, the REST integration is a day of work, and the first three to five dashboards can be built in a week. Value is high: the customer gets a self-service tool instead of a dependency on the development team, and the delivery team can focus on the actual business logic rather than cranking out hundreds of bespoke views.
In practice, this architecture — OmniMES as the transactional system, Redash as the analytical layer — scales much better than the traditional model where every new report is another developer ticket.
Sources
- Redash documentation — Query Results Data Source, 2025.
- Redash documentation — JSON Data Source Handler, 2025.
- MongoDB Inc., Aggregation Framework — Time Series Data, 2025.
- ISO 50001:2018 — Energy management systems.
- OmniMES / OmniEnergy deployment materials, 2025–2026.